Preface
Many manufacturers advertise high wattage figures, but in real-world use solar modules often deliver significantly less. To understand why, it is essential to know under which conditions efficiency is measured and which factors influence it. On this page, we explain step by step what lies behind these specifications and why real-world performance often differs from laboratory values.
Efficiency and Influencing Factors in Solar Modules
1.1 Standard Test Conditions (STC)
To ensure comparability, all solar cells worldwide are tested under identical laboratory conditions.
The electrical power output and efficiency of solar cells and modules are determined under standardized laboratory conditions, known as Standard Test Conditions (STC). These include:
| Irradiance | 1000 W/m² |
| Cell temperature | 25 °C |
| Light spectrum | AAM 1.5 (corresponds to midday sunlight at mid-latitudes) |
Since these conditions occur only in laboratory environments, real-world values are usually lower.
Theoretical Power Calculation under STC
Under these nearly ideal laboratory conditions, the theoretical electrical power of a solar module can be simplified as follows:
Power (W) = Irradiance (W/m²) × Active cell area (m²) × Efficiency (η)
This formula illustrates that the rated power of a solar module does not depend solely on efficiency, but always on the interaction between available solar irradiance, the actually active cell area, and the conversion efficiency of the solar cells.
The application of this formula is meaningful only under defined STC conditions.
Only under these conditions are power and efficiency values from different manufacturers objectively comparable.
In real operating conditions, environmental parameters (temperature, irradiance level, angle of incidence, shading, electrical losses) inevitably deviate from STC, which is why the achievable power output in practice is usually below the theoretical STC value.
1.2 Overview of Cell Technologies
There are different solar cell technologies that differ in manufacturing process, efficiency, and application.
- Monocrystalline
- Polycrystalline
- Thin-film
- Bifacial
The most important types are briefly explained below.
1.2.1 Monocrystalline Solar Cells (mono-Si)
- Manufacturing: Cut from a single, continuous silicon crystal (Czochralski process).
- Appearance: Uniform dark color (black to dark blue), usually with rounded corners.
- Efficiency: Typically 18–23 %, top-tier laboratory cells up to approx. 26 %.
- Advantages:
- Highest efficiency per unit area.
- Good performance under diffuse light.
- Long service life (20–25 years).
- Disadvantages:
- Higher production costs.
- More complex manufacturing process.
1.2.2 Polycrystalline Solar Cells (poly-Si)
- Manufacturing: Cast from molten, multi-crystalline silicon and then sawn into wafers.
- Appearance: Light blue, crystalline, irregular structure.
- Efficiency: Typically 13–18 %.
- Advantages:
- Lower production costs.
- Proven, long-established technology.
- Disadvantages:
- Lower efficiency → larger area required for the same power output.
- Weaker performance under diffuse light.
1.2.3 Thin-Film Solar Cells (a-Si, CdTe, CIGS)
- Manufacturing: Deposition of thin semiconductor layers on glass, metal, or plastic substrates.
- Appearance: Very dark, uniform, often flexible.
- Efficiency: Typically 7–12 %.
- Advantages:
- Flexible designs possible (e.g. for backpacks, mobile applications).
- Relatively good performance under low light or high temperatures.
- Disadvantages:
- Significantly lower power per unit area.
- Shorter service life, higher degradation.
- Frequently used in low-cost, foldable panels.
1.2.4 Bifacial Cells (Special Case)
- Characteristic: Bifacial ratio typically 70–85 %.
- Technology: Utilizes both front and rear side for energy generation (reflected light).
- Advantages:
- 5–15 % additional power when used above reflective surfaces (e.g. snow, bright ground).
- Disadvantages:
- Effective only under suitable environmental conditions.
Summary of Cell Types
| Cell type | Efficiency | Area for 30 W | Durability | Price level | Appearance |
| Mono | 20–23 % | small | 20–25 yrs | high | black, uniform |
| Poly | 13–18 % | larger | 15–20 yrs | mitmedium | blue, crystalline |
| Thin-film | 7–12 % | very large | 10–15 yrs | low | sehr very dark, flexible |
| Bifacial (add-on) | +5–15 % (with reflection) | similar to mono | 20–25 yrs | high | transparent rear side |
1.3 Difference Between Cell and Module
Solar cells can achieve very high efficiency under STC. Modern monocrystalline cells reach approximately 26 % efficiency.
In the finished module, however, this value decreases due to additional losses caused by:
- interconnection of cells,
- electrical contact resistance,
- covering materials such as glass or plastic,
- frame and cabling.
As a result, the real module efficiency typically lies between 20–23 %.
1.4 Cell Temperature vs. Ambient Temperature
In photovoltaics, all temperature specifications refer not to ambient air temperature, but to cell temperature.
In practice, cell temperature is almost always significantly higher than air temperature, because solar cells absorb solar radiation and can only dissipate heat to the environment to a limited extent.
To estimate real cell temperature, photovoltaics use the NOCT (Nominal Operating Cell Temperature) value. This describes the typical cell temperature under defined conditions:
- 20 °C ambient temperature
- 800 W/m² irradiance
- 1 m/s wind speed
Depending on module type, NOCT typically ranges between 40 and 48 °C.
The cell temperature can be approximated using the following formula:

Where:
Tcell = cell temperature
Tamb = ambient temperature
G = irradiance in W/m²
Typical examples:
- Summer: 30 °C air temperature, 1000 W/m² → approx. 60 °C cell temperature
- Spring: 15 °C air temperature, 1000 W/m² → approx. 45–50 °C cell temperature
- Winter: 0 °C air temperature, 1000 W/m² → approx. 30–35 °C cell temperature
Anhand der folgenden Darstellung lässt sich die Wirkung der Außentemperatur auf die Zelle Ablesen:
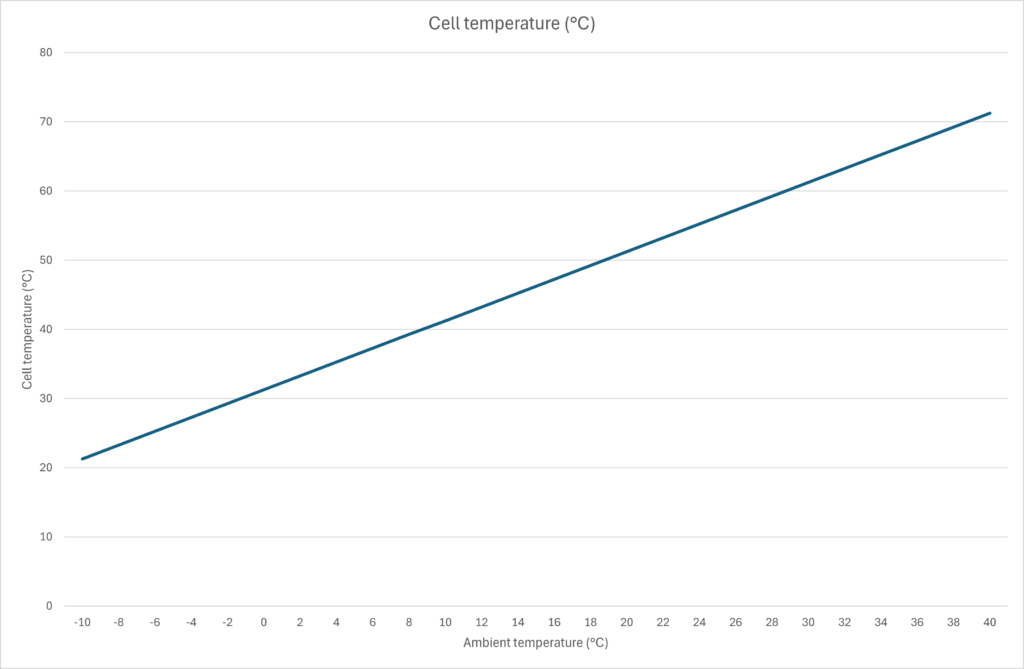
Implications:
- In summer, cell temperatures above 60 °C can occur, reducing efficiency by several percent.
- In winter, cells remain significantly cooler, resulting in higher efficiency — even when sunlight appears weaker.
- Under optimal conditions (cold air + direct sunlight), a module can sometimes produce more power than on a hot summer day.
1.5 Influence of External Conditions in Practice
a) Temperature
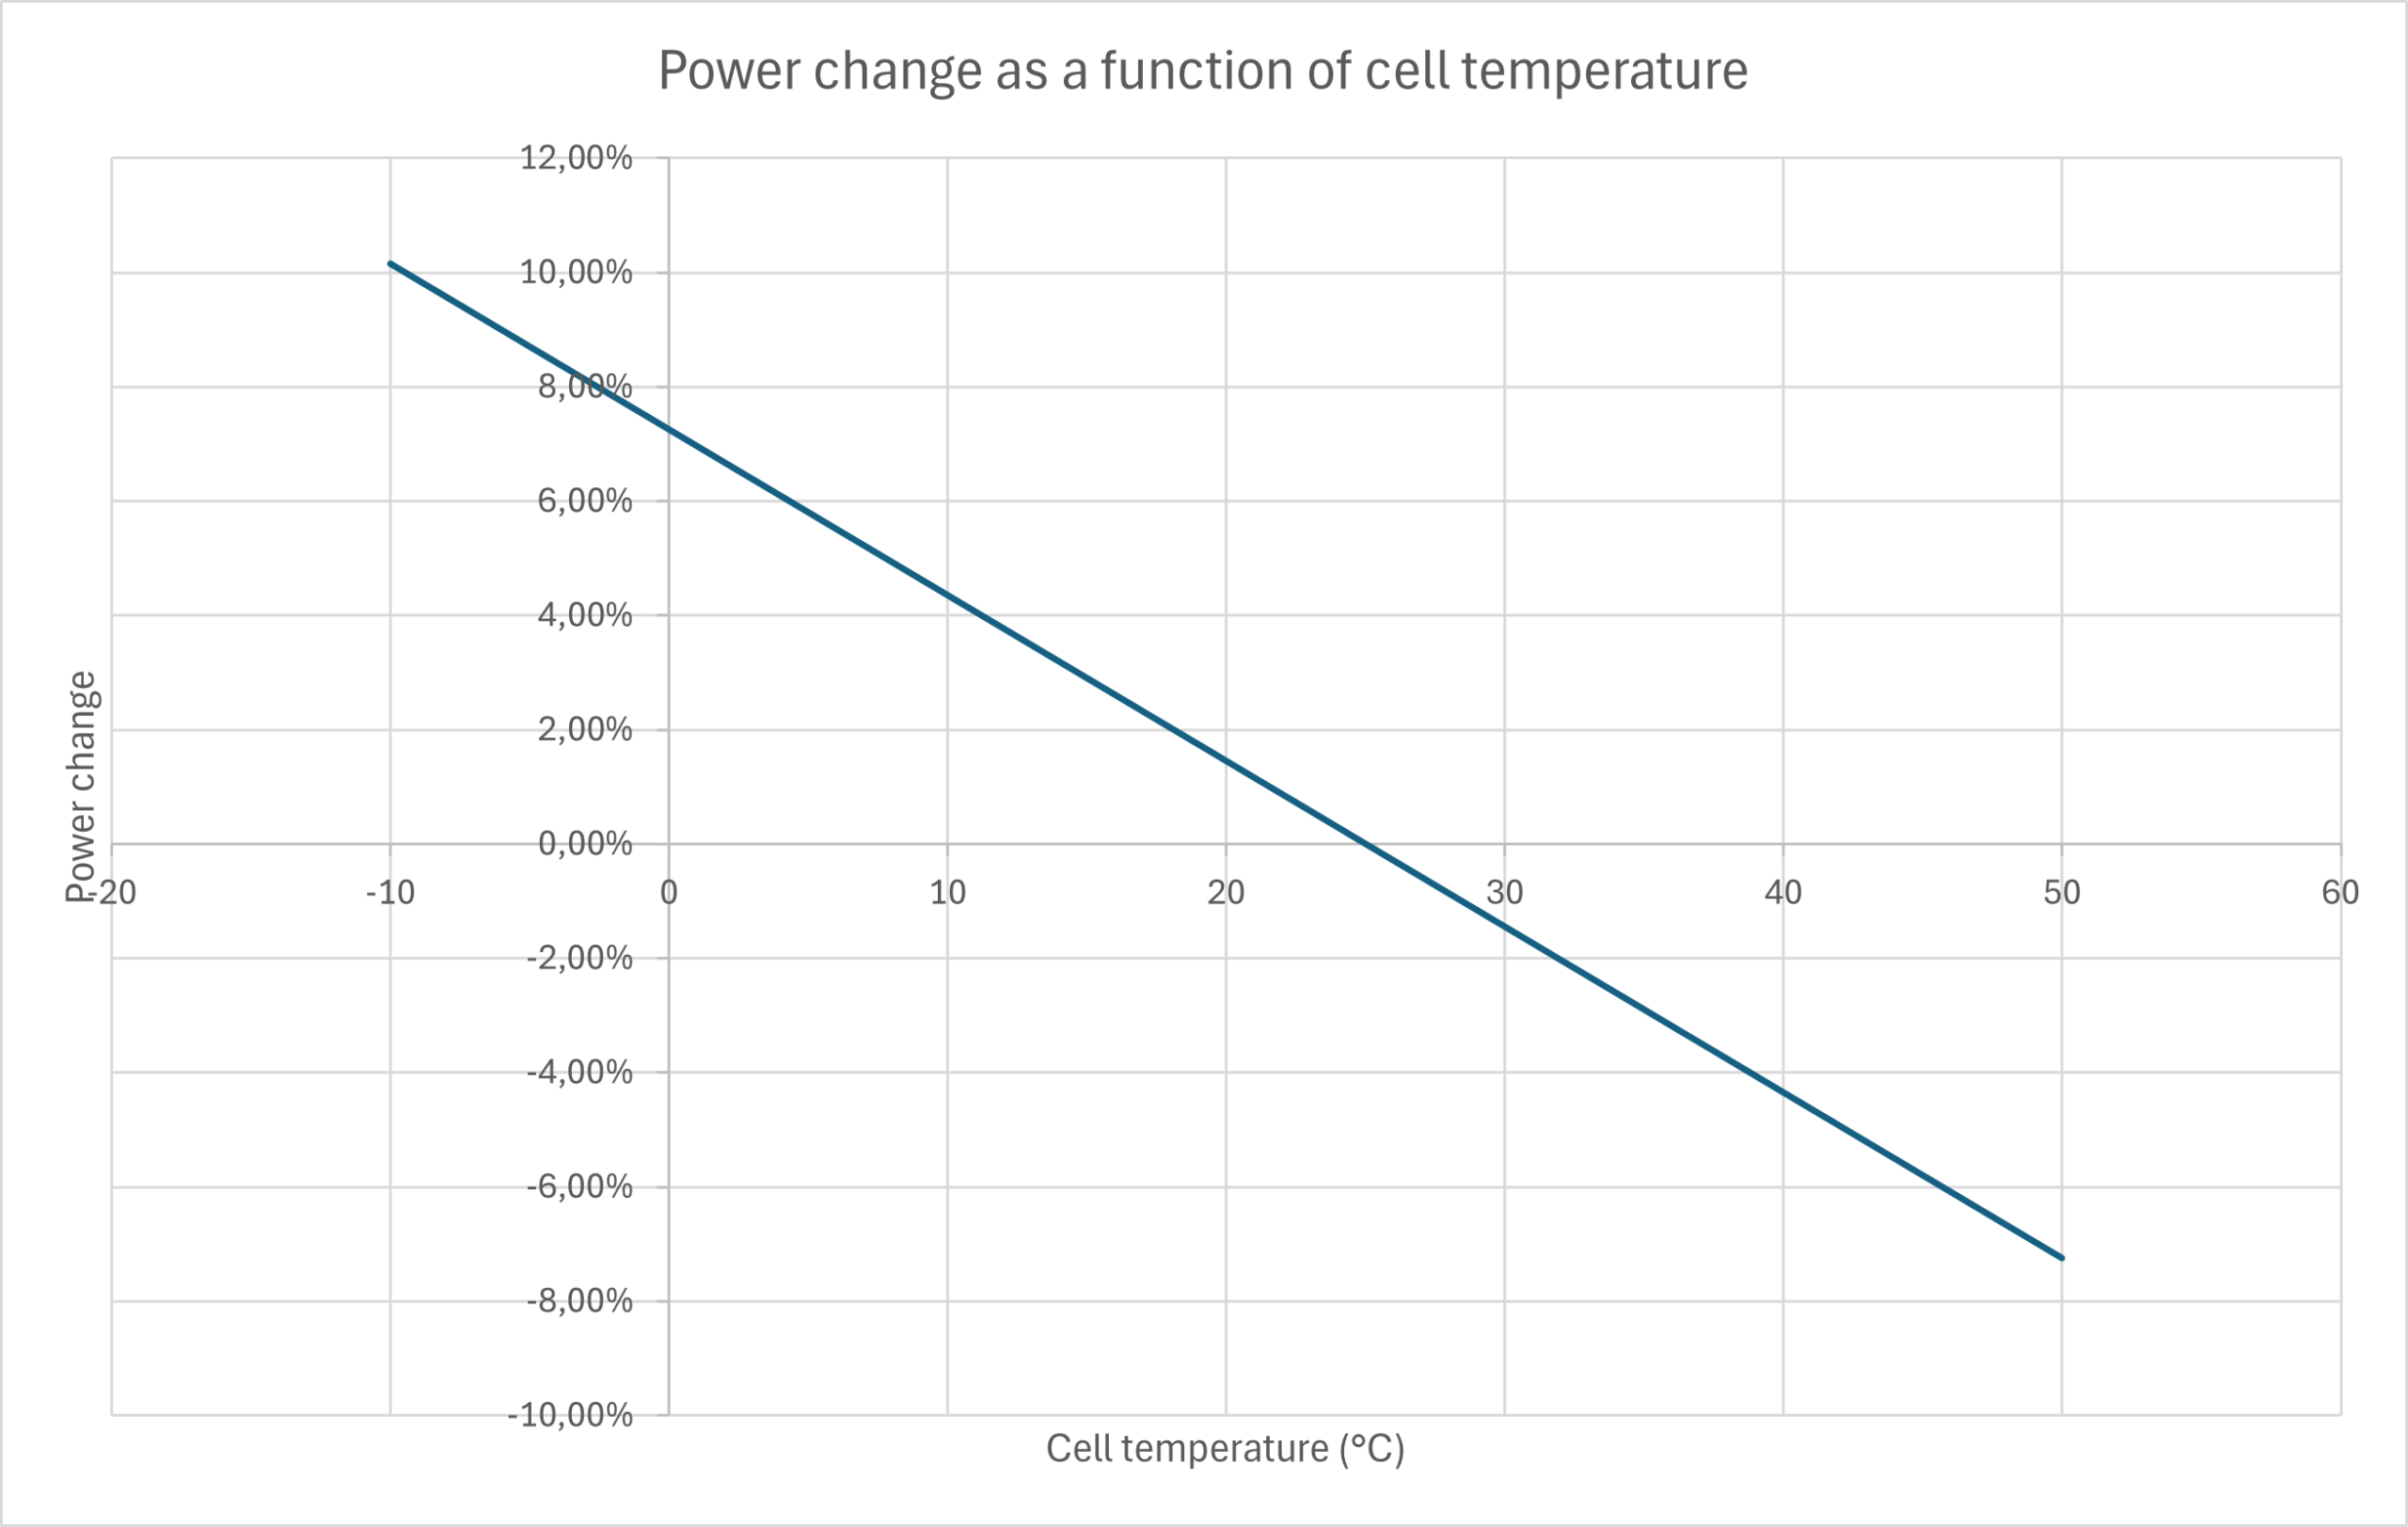
The power output of solar cells decreases with increasing temperature. The typical temperature coefficient for power is approximately –0.29 % per °C.
This means:
- +10 °C above STC → approx. 3 % power loss
- Typical summer cell temperature: 45–50 °C
- Resulting power reduction: approx. 7–8 % compared to laboratory values
Daraus resultieren die folgenden Auswirkungen der Temperatur auf die Leistung:
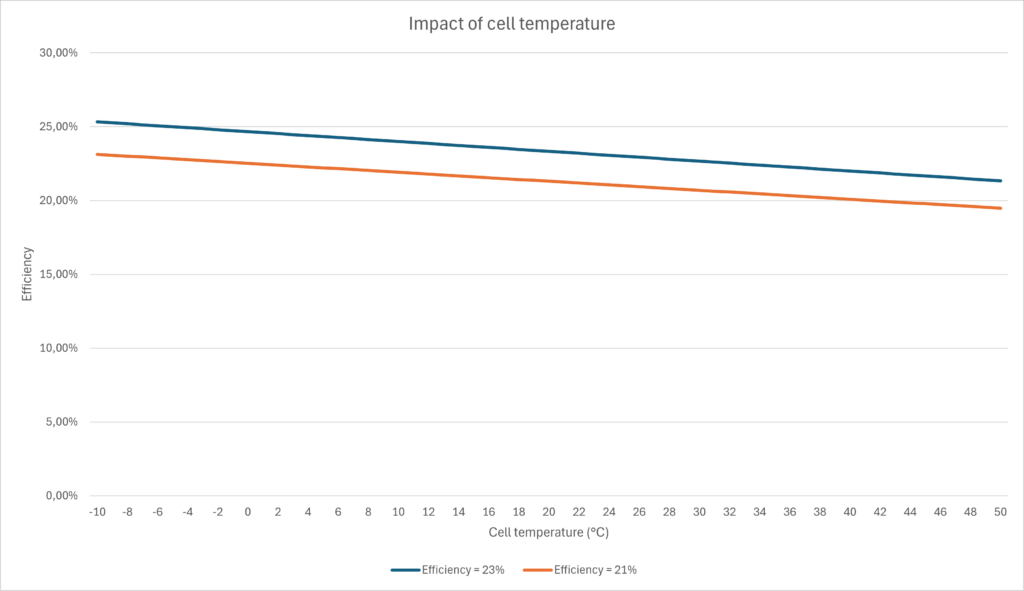
Daraus resultieren die folgenden Auswirkungen der Temperatur auf die Wirkungsgrade:
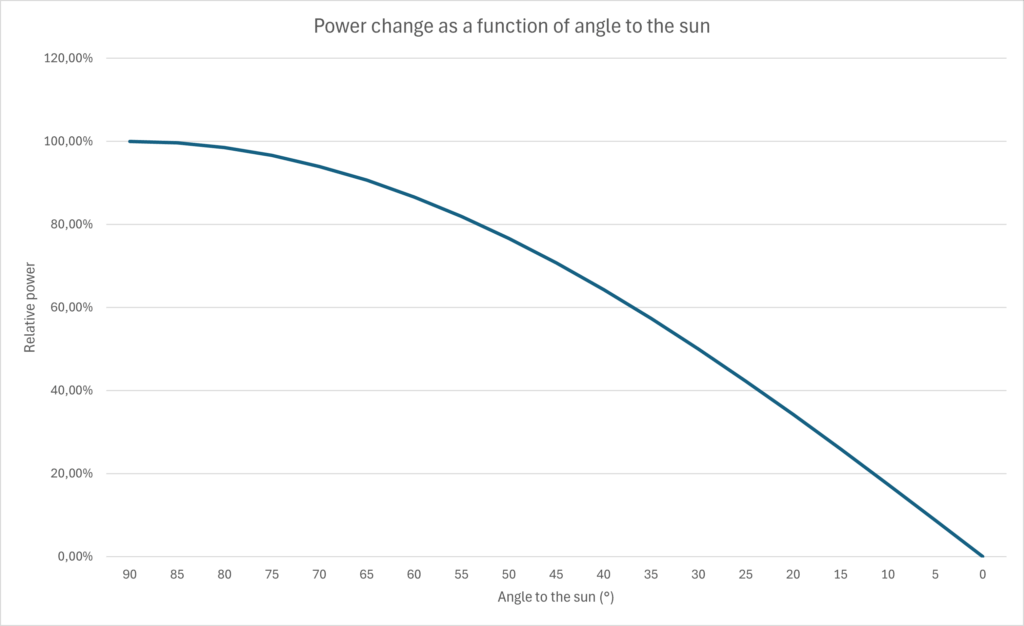
b) Angle of Incidence
Maximum power is achieved only when sunlight strikes the cells perpendicularly. Even small deviations reduce output:
- Perpendicular incidence (90°) → 100 %

- Flacher Winkel (z. B. 45°) → deutlich weniger Leistung
- Abweichungen können durch Nachführung oder geeignete Neigung reduziert werden.
- Rule of thumb: Proportional to the cosine of the deviation angle (cos θ)
- 0° deviation → cos(0°) = 1 → 100 %
- 30° deviation → cos(30°) ≈ 0.87 → 87 %
- 45° deviation → cos(45°) ≈ 0.71 → 71 %
- 60° deviation → cos(60°) = 0.50 → 50 %
- 75° deviation → cos(75°) ≈ 0.26 → 26 %
- In practice, this means that during morning and evening hours, only a fraction of the potential power is available — even when it still appears bright.

c) Spectrum and Weather Conditions
STC values are based on a defined light spectrum. In reality, the spectrum varies due to:
- season
- humidity
- dust and air pollution
- cloud cover
Under diffuse light (cloudy sky), power output drops significantly:
- Clear sky → 100 %
- Light cloud cover → 60–80 %
- Heavy cloud cover → 20–40 %
d) Shading
Partial shading of individual cells can drastically reduce power output, because many cells are connected in series.
- Even small shadows (branches, roof edges) can affect the output of an entire string.
- Bypass diodes reduce this effect, but cannot completely eliminate it.
Quellenhinweis:
Alle Angaben basieren auf anerkannten Fachquellen, darunter Studien und Reports von Fraunhofer ISE, NREL (National Renewable Energy Laboratory), TÜV Rheinland sowie technische Daten etablierter Hersteller (z. B. SunPower, Solaria). Weitere Informationen finden sich in Fachartikeln von PV Magazine, Solar Power Europe und anderen unabhängigen Energieplattformen.
| Quelle | Link |
|---|---|
| Fraunhofer ISE – Photovoltaics Report (2023/2025) → Wirkungsgrade von Zellen & Modulen, STC, Technologievergleich | https://www.ise.fraunhofer.de/content/dam/ise/de/documents/publications/studies/Photovoltaics-Report.pdf |
| pv-wissen.de (DGS Berlin & HTW Berlin) → STC, NOCT, Temperaturkoeffizient, reale Bedingungen, Modul vs. Zelle | https://www.pv-wissen.de/ |
| PVEducation.org → Grundlagen zu Einfallswinkel (cos θ), Verschattung, Bypass-Dioden | https://www.pveducation.org/ |
| Energy.gov – Solar Energy Basics → Einfluss von Jahreszeit, Tageszeit, Atmosphäre, Bewölkung | https://www.energy.gov/ |
| Fraunhofer ISE – Bifacial PV Modules → Bifacial-Technologie, Mehrerträge, technische Hintergründe | https://www.ise.fraunhofer.de/en/publications/studies.html |